Personal Budget Spreadsheet
Create a yearly budget with projected savings for the entire year using this budget spreadsheetOur Personal Budget Spreadsheet enables you to track, manage and calculating your income, expenses and savings. The first sheet is a Personal Budget sheet that holds records of income, expenditure and savings details of an individual on a monthly basis. This template includes most of the heads of expenses. We highly recommend keeping this sheet regularly updated for a real and dynamic insight. The spreadsheet assists you with setting some savings goals as well. The monthly breakdown helps you in identifying and analyzing the months that you saved more and the ones on which you spent more. You can easily track different types of expenses under categories, such as home, daily living, transportation, etc. The sheet also gives the Potential To Save value for each month.
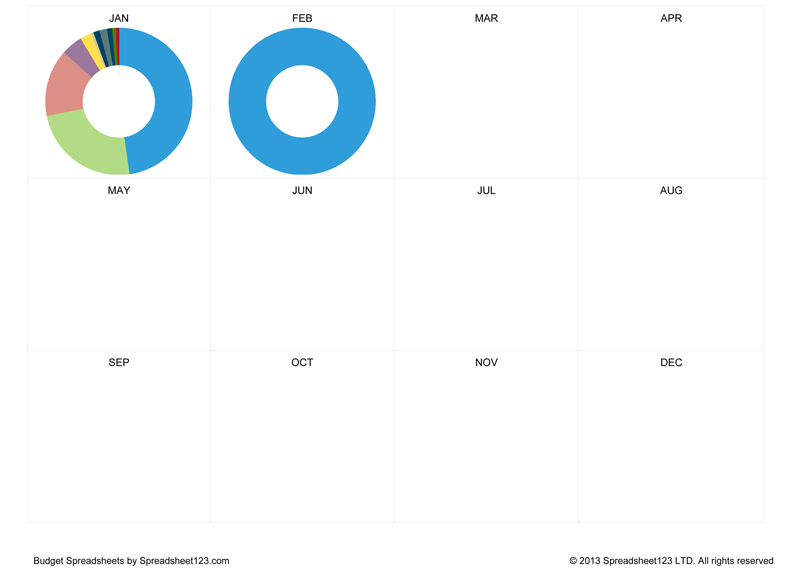
The second worksheet is the Dashboards that provides summarized data of the Personal Budget graphically. The income and annual expenses are represented as pie charts. This provides an easy to understand distribution view of the budget. There are also bar charts and doughnut charts that depict a monthly distribution of the expenses under various heads. Moreover, this spreadsheet contains an income, expenditure, and savings line chart.
Personal Budget Spreadsheet
for Excel & OpenOffice.org Calc
Categories
BudgetsScreenshots
1 2 3 4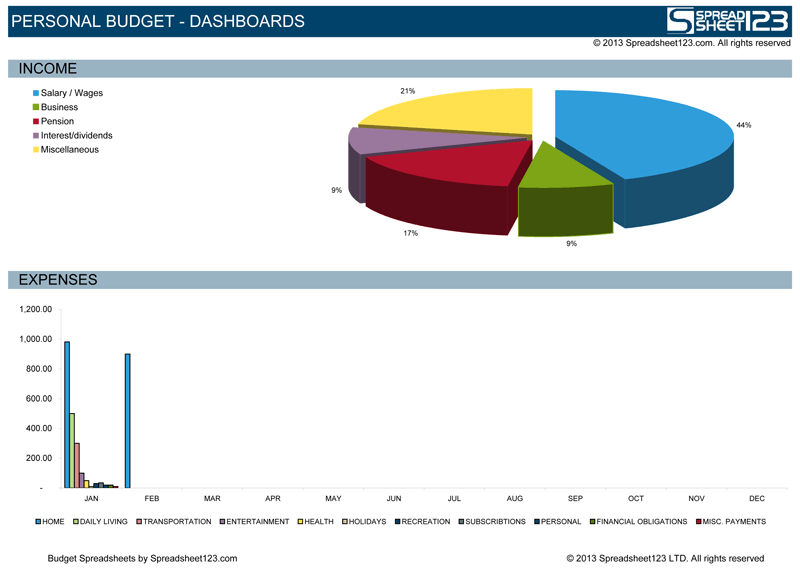
License
Specifications
Creating Your Personal Budget
Start by downloading the template and recording into the spreadsheet your income, followed by expenses. The first worksheet is the personal budget worksheet that will hold the details of the possible sources of income, as well as amounts received through each of the sources. There are various sources of income included by default in this template:
- Salary / Wages
- Business
- Pension
- Interest / Dividends
- Miscellaneous
The worksheet also includes a savings goal set for each month that one should aim to achieve through successful budgeting. The savings goal can be a single goal or a set of projected goals. The net value of the savings goal is calculated monthly, as well as on the basis of an aggregated annual amount of savings. The monthly analysis helps to obtain a projected image of the overall savings targets that individuals aim to achieve and the amounts they can potentially allocate towards their savings. It also helps with making better savings and expenditures decisions.
- Home
- Daily Living
- Transportation
- Entertainment
- Health
- Holidays
- Recreation
- Subscriptions
- Personal
- Financial Obligations
- Miscellaneous Payments
Potential savings made by an individual are calculated by simple subtraction of the sum of the Total Savings Goal and the Total Expenses from the Total Income. This value is calculated both on a monthly and annual bases.
The Dashboards worksheet shows a summary of your personal budget in four different charts. These four distributions are:
- Income
The Income pie chart reflects the share of each source of the income, which you receive. The chart makes it easy to interpret the income source with the largest and smallest shares. - Expenses
The bar chart is a representation of the monthly expenses by category. The same data is also used in the doughnut charts, which shows the share of each expense category. - The Annual - Expense and Distribution Pie
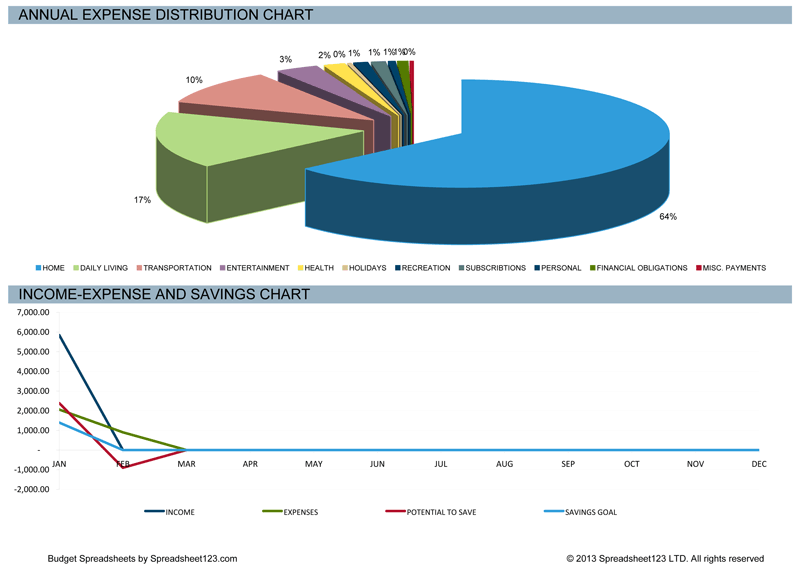
This pie chart shows the percentage share of the summarized expenses incurred throughout the year. The chart enables you to determine categories with most and least expenditures, which can help you to analyze your budget farther and possibly identify some categories with partly or altogether avoidable expenses. - The Income - Expense and Savings Chart
The line chart depicts the status of the various categories, such as income and expenses for each month relative to the previous month. The following groups are reflected in this chart:- Income
- Expenses
- Potential to Save
- Savings Goal
What does the "Potential to Save" value mean?
The potential to save is the amount of money a person can save in a month either by an increased income or a decreased spending. The ideal value is 0 (zero), which indicates that any increases in the income or decreases in expenses are automatically allocated towards savings. The value will be achieved if the savings goals have been attained.
What does the Personal Budget Dashboards worksheet do?
The dashboard’s worksheet makes the budget easier to comprehend and analyze with the help of graphs and charts. The report provides a summary of the personal budget based on the Income pie chart, Expenses bar graph, annual expense distribution pie chart, and income expense, and savings chart. The dashboard provides a summary of the various expenses and savings. It can help you to analyze your budget and make important decisions on augmenting the income and savings, and reducting the unnecessary expenses.
Excel Function used in this template
- SUM(number1, [number2], [number3], [number4], ...)